 Best Electrician Jobs

About this analysis: This article explains the August 1, 2026 data release of the Electrician Payoff Report. It uses BLS May 2025 wages, BEA 2024 regional prices and HUD FY2026 rent benchmarks. It does not introduce newer observations.
California’s electrician median wage is $36.62 an hour in the report’s BLS data. That places the state #15 among the 50 states and Washington, DC. Apply the report’s adjustment for regional price levels, and California moves to #32, at $33.07 in national-price-level dollars per hour.
The 17-place difference is a comparison between two ways of ranking the same wage observations. It is not a claim that California lost ground during the year, that wages fell, or that an individual worker’s paycheck changed. Its relevance is practical: a higher posted hourly rate can coexist with weaker buying power when the surrounding price level is higher.
What the adjustment actually does
The report divides the BLS median hourly wage by the BEA all-items Regional Price Parity divided by 100. The price measure provides a common national-price-level reference for comparing places. It does not estimate a particular electrician’s spending, deduct income taxes, or account for household size.
Mississippi illustrates the other direction: its published nominal median wage is tied for 40th, while its cost-adjusted wage ranks 25th. The contrast does not make either state the right choice for every worker. It shows why using an hourly rate alone can change the conclusion of a geographic comparison.

Download PNGDownload SVGPermanent finding link
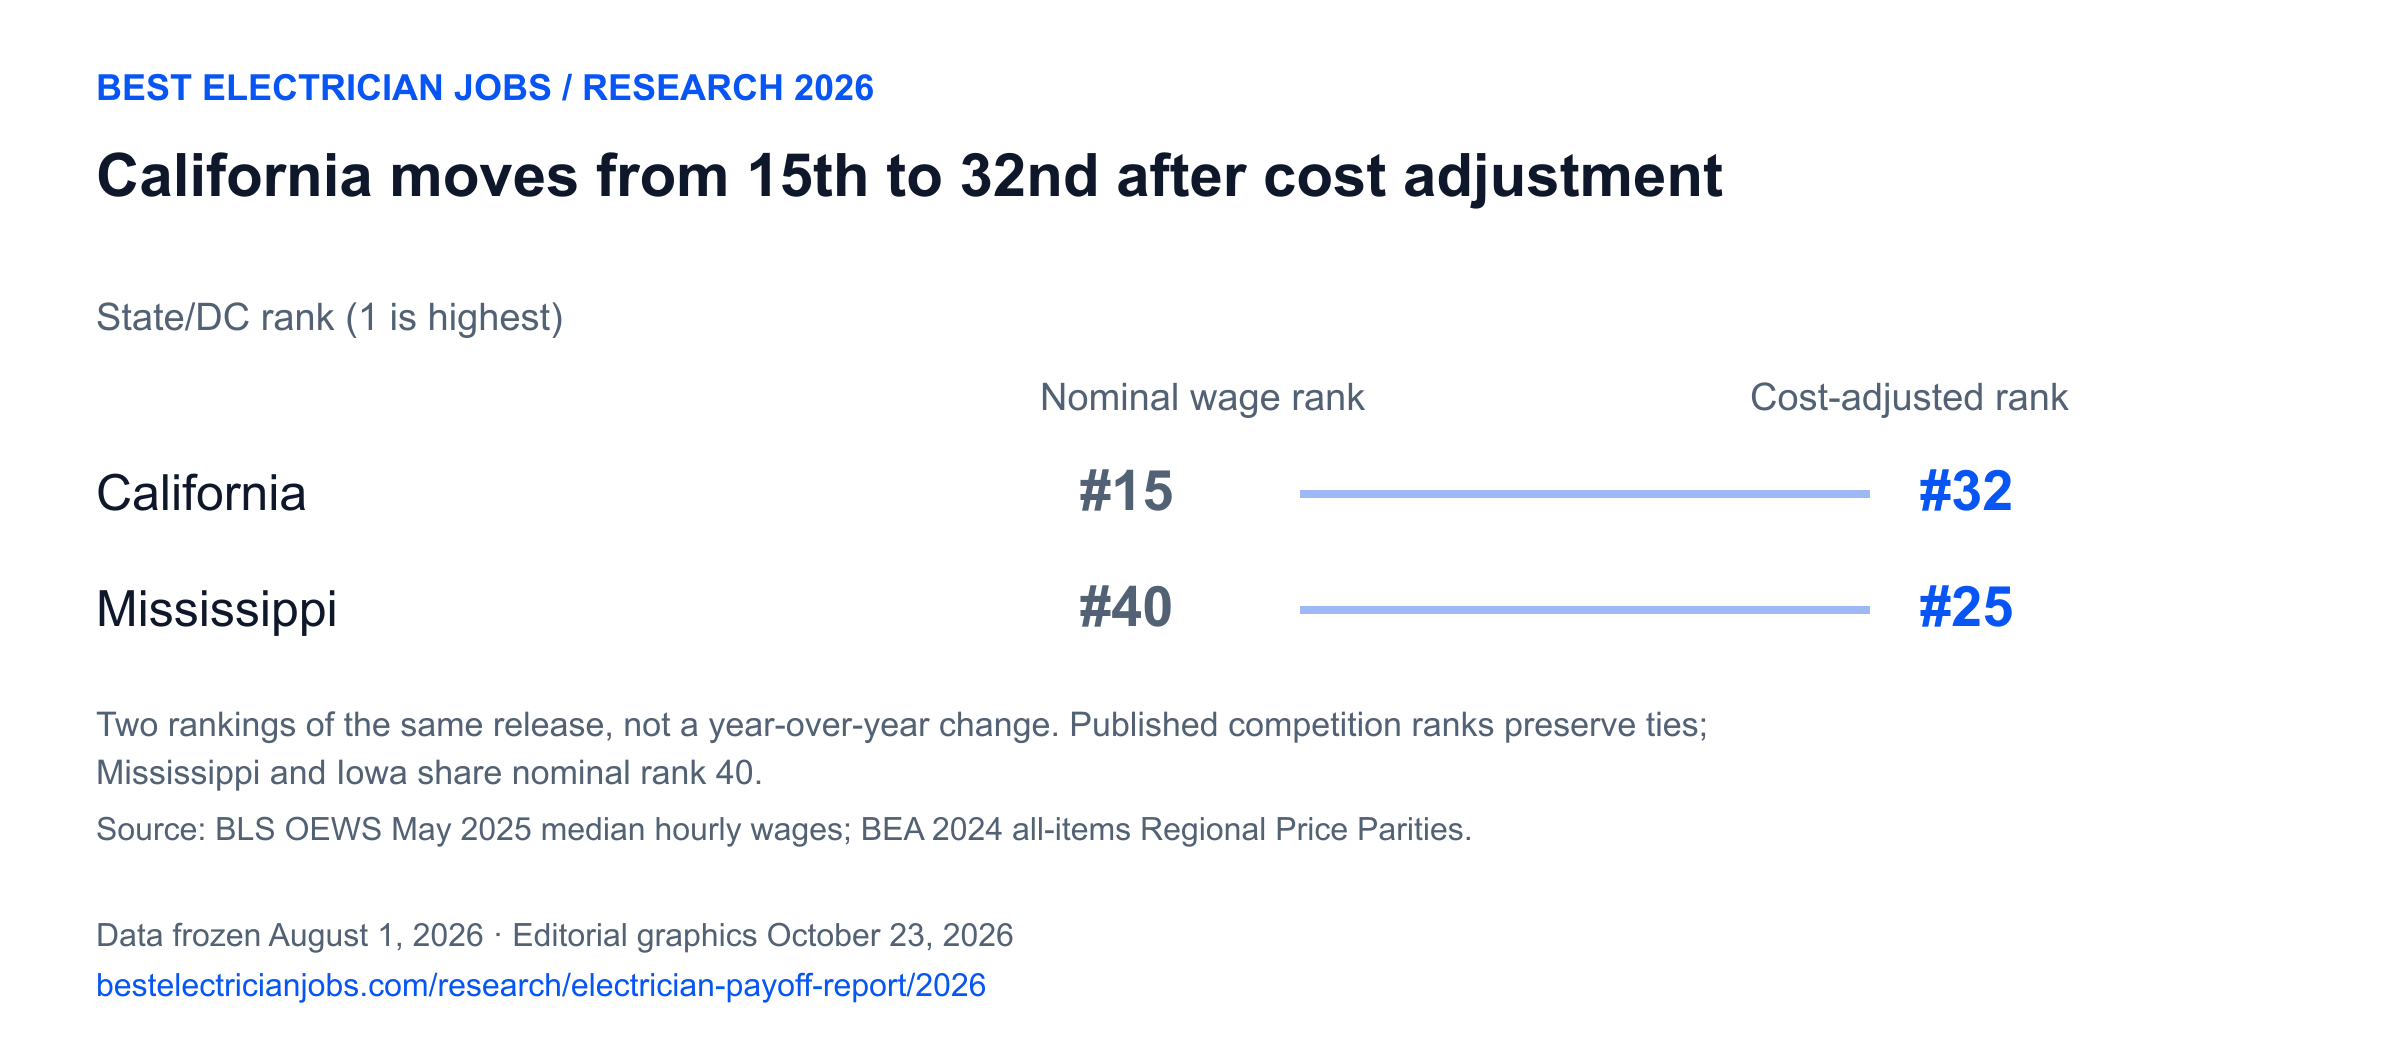
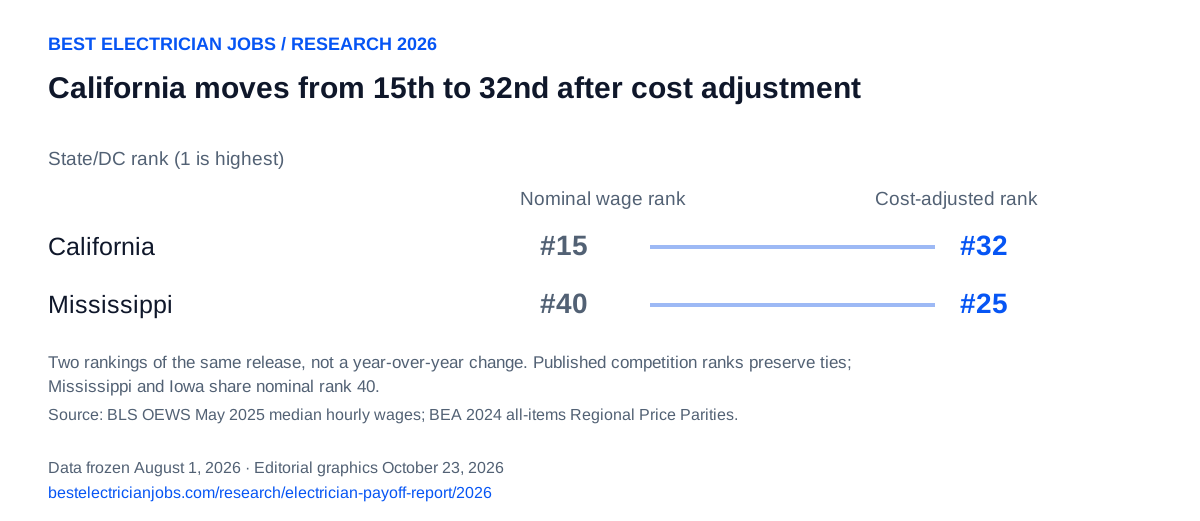
View the chart data
| Place | Nominal rank | Adjusted rank |
|---|---|---|
| California | #15 | #32 |
| Mississippi | #40 | #25 |
California’s metro areas deserve a separate look
A statewide figure combines very different local markets. The table below shows the highest cost-adjusted wages among the California metros included in this report, including cross-state metros when applicable. Each is part of a fixed selection of 100 metros based on published electrician employment, so this is not a ranking of every city in California.
| Metro | Median wage/hr | Adjusted pay/hr | 1BR rent / shifts |
|---|
Compare the state with other markets
| State | Median wage/hr | Adjusted pay/hr | 1BR gross-pay shifts |
|---|---|---|---|
| California | $36.62 | $33.07 | 8.0 |
| Oregon | $48.71 | $47.13 | 4.0 |
| Illinois | $47.87 | $47.89 | 3.9 |
| Florida | $27.52 | $26.61 | 8.2 |
Use these comparisons as evidence for a specific question. The largest employment count does not identify the most openings, and a high adjusted wage does not account for licensing requirements, overtime premiums, benefits or an individual household’s expenses. The report publishes each measure separately so readers can inspect those tradeoffs.
Check the finding and explore the evidence
Read the national finding, or open California in the interactive report. The explorer retains all state/DC and selected metro comparisons, wages, housing measures, employment and quality notes.
The public data package includes state and metro CSVs, an Excel workbook, published ranks, quality flags, the data dictionary, methodology and exact source versions. Review the government sources before using a result. These are observations from the original release, not a description of current job offers or apartment availability.