 Best Electrician Jobs

About this analysis: This article explains the August 1, 2026 data release of the Electrician Payoff Report. It uses BLS May 2025 wages, BEA 2024 regional prices and HUD FY2026 rent benchmarks. It does not introduce newer observations.
Illinois leads all 50 states and Washington, DC in the report’s cost-adjusted median electrician wage: $47.89 an hour in national-price-level dollars. Its published nominal median wage is $47.87 an hour. The two figures are close because the state’s overall regional price level is close to the national reference used by the calculation.
The report’s median across the 51 jurisdictions is $33.55 in cost-adjusted hourly pay. That describes the middle jurisdiction in the state/DC comparison. It is not the wage earned by the median American electrician and should not be substituted for the separately published BLS national median.
What Illinois’s lead means
Cost-adjusted pay compares local median wages after accounting for regional price differences. Illinois’s lead is a finding about this measure and this frozen release. It does not establish the highest take-home pay, the best benefits, or a wage every employer must offer.
The analysis does not isolate union membership, license level, years of experience or apprenticeship stage. Those factors may matter to a job decision, but these data cannot establish why Illinois ranks first or attribute its lead to a specific cause. The wage percentiles in the explorer describe the distribution; they are not apprentice, journeyman or master pay bands.

Download PNGDownload SVGPermanent finding link
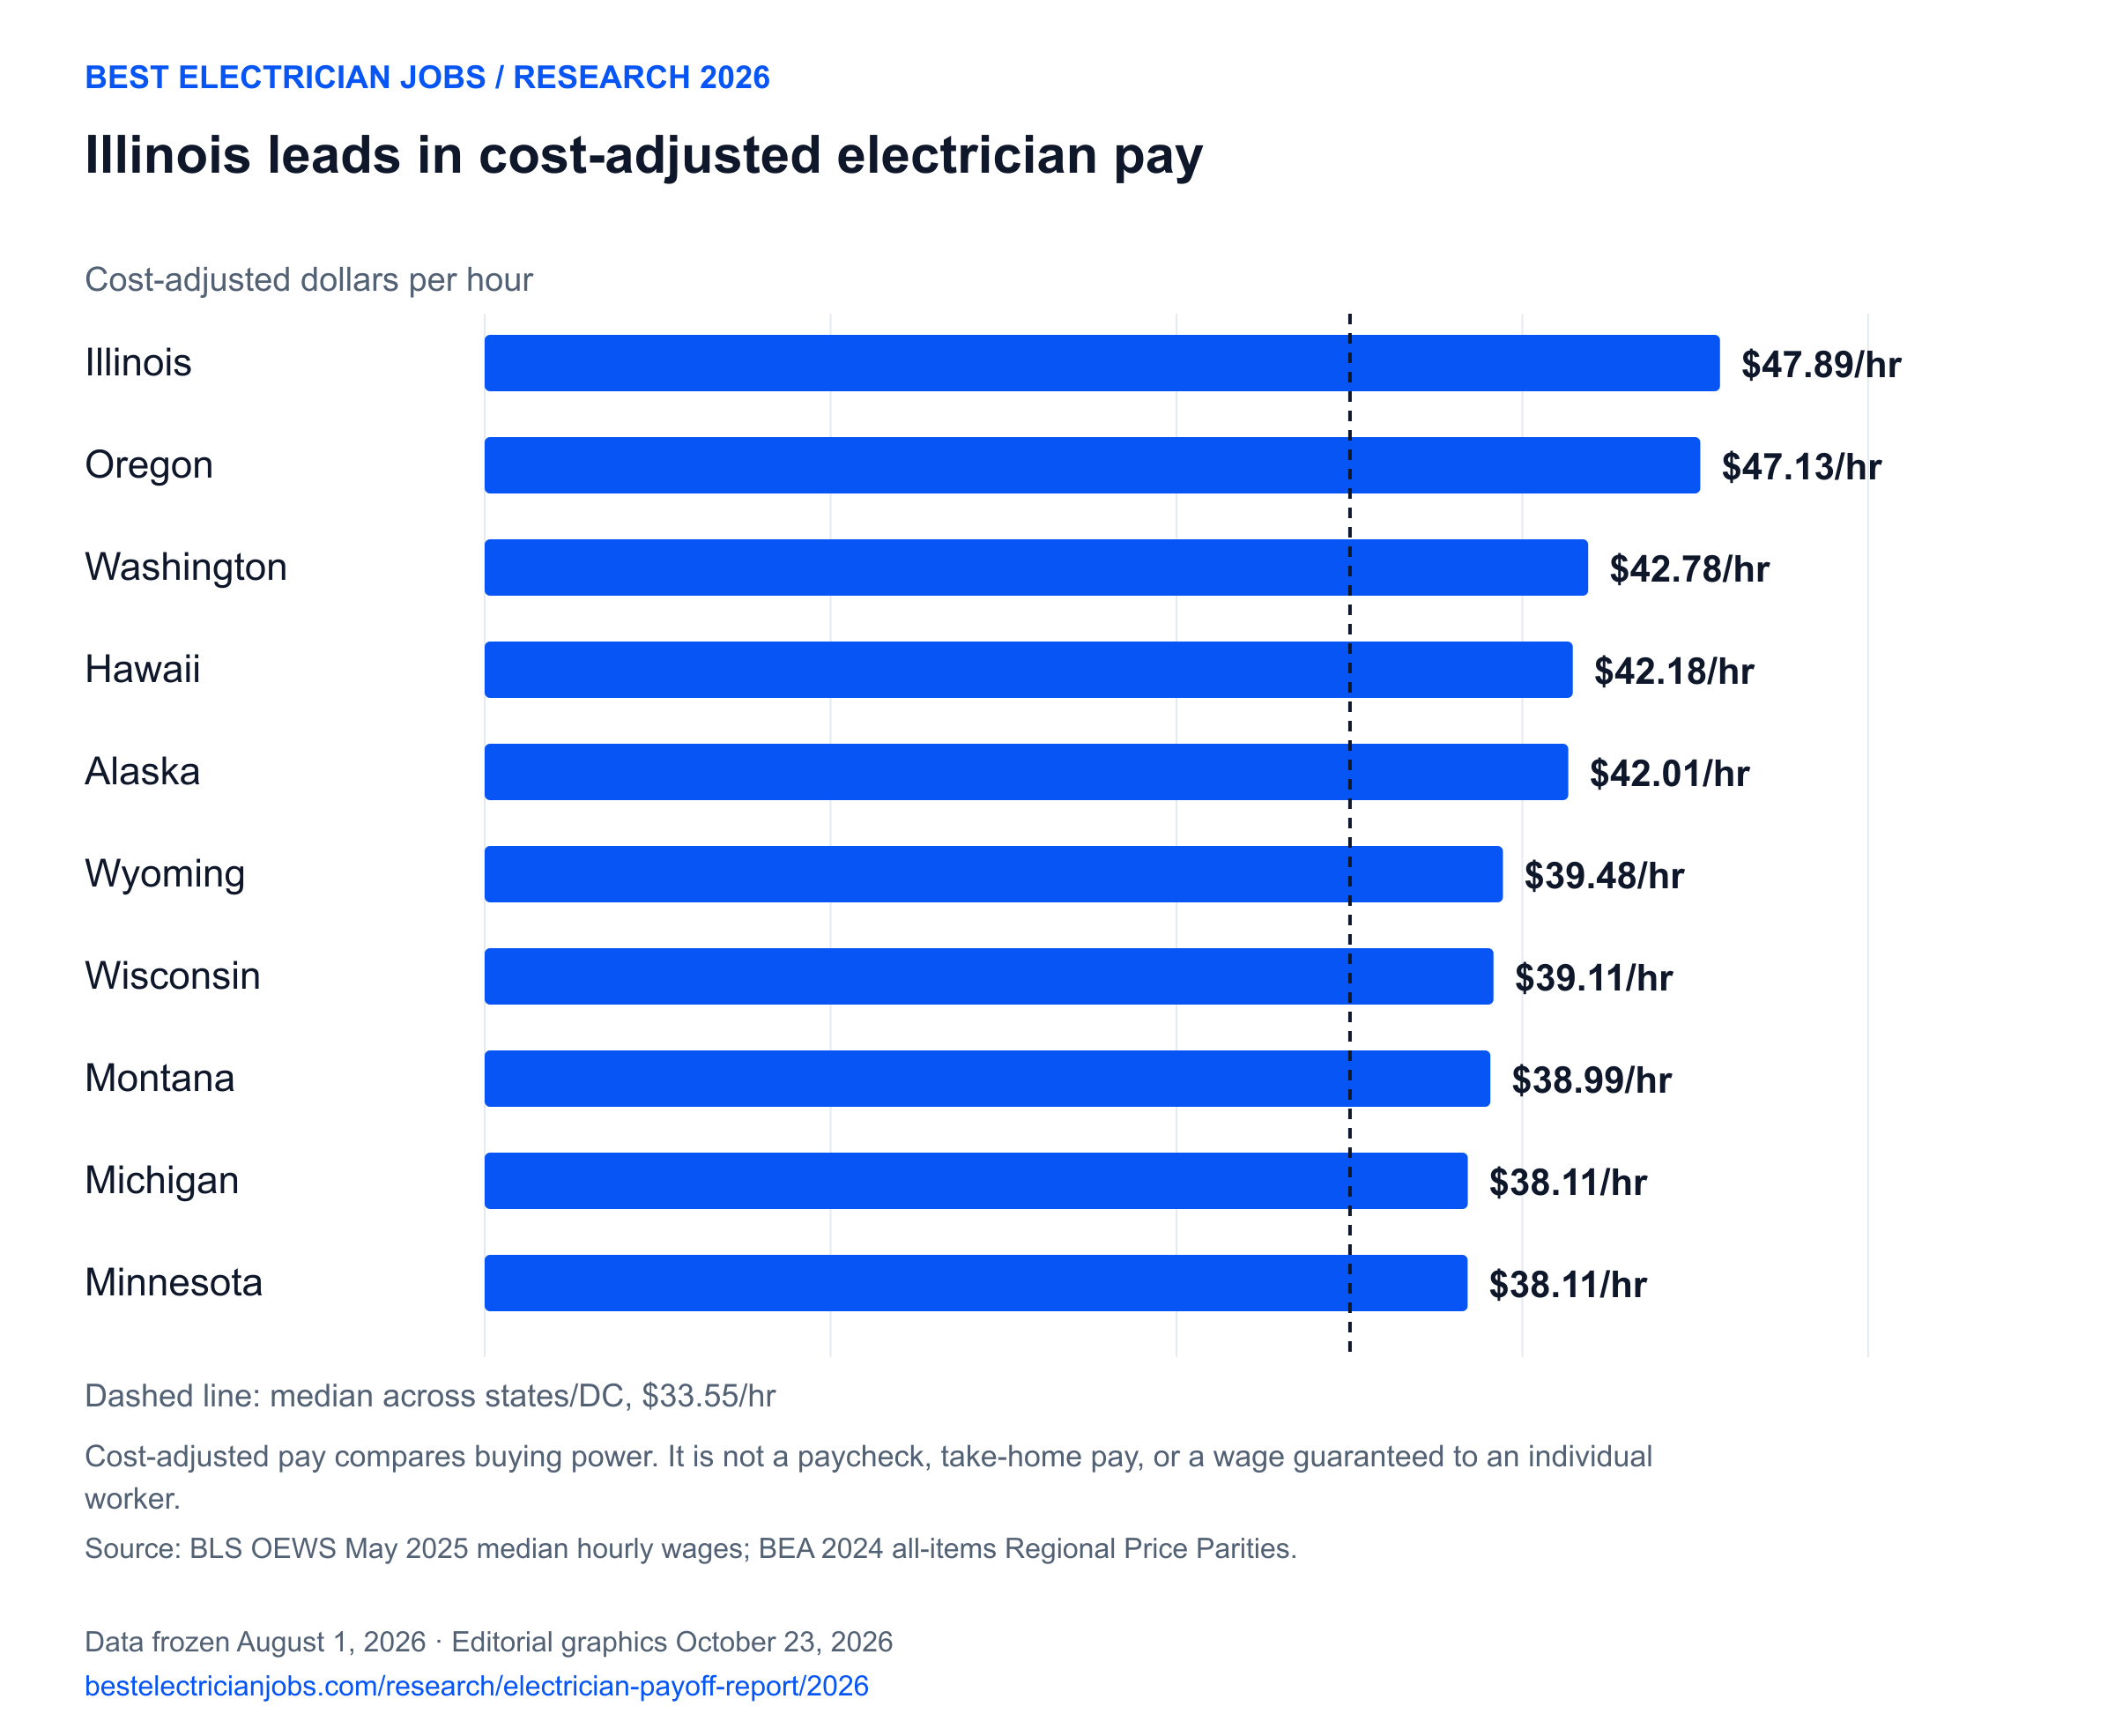
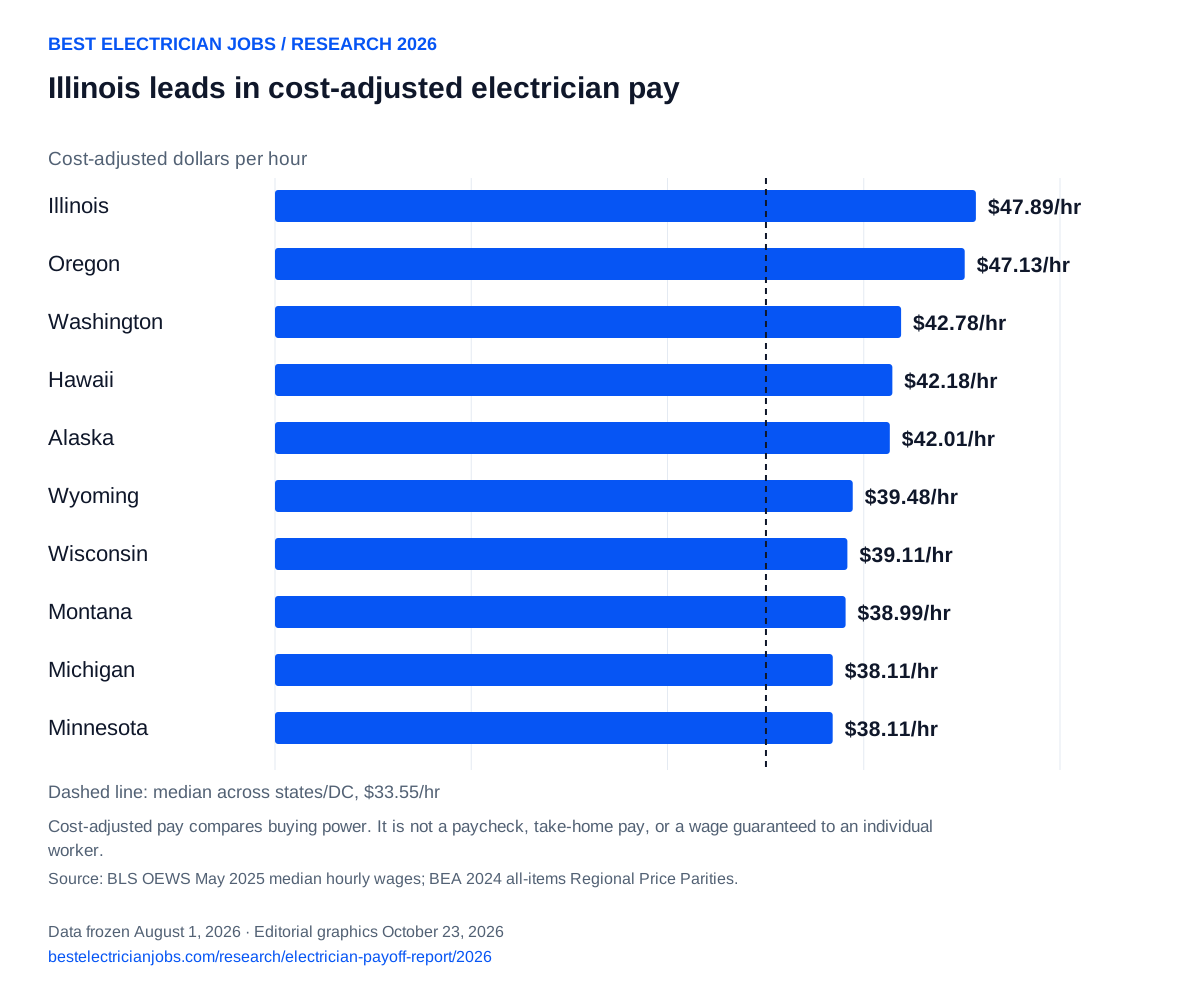
View the chart data
| Place | Cost-adjusted dollars per hour |
|---|---|
| Illinois | $47.89/hr |
| Oregon | $47.13/hr |
| Washington | $42.78/hr |
| Hawaii | $42.18/hr |
| Alaska | $42.01/hr |
| Wyoming | $39.48/hr |
| Wisconsin | $39.11/hr |
| Montana | $38.99/hr |
| Michigan | $38.11/hr |
| Minnesota | $38.11/hr |
Median across the 51 state/DC jurisdictions: $33.55/hr. This is not the national worker median.
Buying power and housing are separate comparisons
Illinois’s one-bedroom rent benchmark is $1,490 a month, equal to 3.9 eight-hour shifts of gross median pay. The rent ratio uses nominal wages and does not subtract taxes. Cost-adjusted hourly pay uses an all-items price index that already includes housing-related prices; the two measures should not be added together or used to deduct housing twice.
Illinois and Wisconsin meet the report’s published “balanced leader” rules. That label identifies agreement across explicit thresholds for buying power, rent pressure and the state long-hours measure. It is not a proprietary overall score or a recommendation that every worker relocate.
Look beyond the statewide number
The Illinois metros included below may cross state lines. Their results illustrate why comparing a specific work market with its own rent benchmark can be more useful than applying one statewide figure to every opportunity. They belong to the report’s 100-metro selection, not an exhaustive list of Illinois cities.
| Metro | Median wage/hr | Adjusted pay/hr | 1BR rent / shifts |
|---|---|---|---|
| Davenport-Moline-Rock Island, IA-IL | $36.99 | $41.52 | $986 / 3.3 |
| St. Louis, MO-IL | $37.10 | $39.02 | $1,074 / 3.6 |
Compare the state with other markets
| State | Median wage/hr | Adjusted pay/hr | 1BR gross-pay shifts |
|---|---|---|---|
| Illinois | $47.87 | $47.89 | 3.9 |
| Wisconsin | $36.80 | $39.11 | 3.8 |
| Indiana | $32.93 | $35.28 | 4.2 |
| Michigan | $36.67 | $38.11 | 3.9 |
Use these comparisons as evidence for a specific question. The largest employment count does not identify the most openings, and a high adjusted wage does not account for licensing requirements, overtime premiums, benefits or an individual household’s expenses. The report publishes each measure separately so readers can inspect those tradeoffs.
Check the finding and explore the evidence
Read the national finding, or open Illinois in the interactive report. The explorer retains all state/DC and selected metro comparisons, wages, housing measures, employment and quality notes.
The public data package includes state and metro CSVs, an Excel workbook, published ranks, quality flags, the data dictionary, methodology and exact source versions. Review the government sources before using a result. These are observations from the original release, not a description of current job offers or apartment availability.