 Best Electrician Jobs

About this analysis: This article explains the August 1, 2026 data release of the Electrician Payoff Report. It uses BLS May 2025 wages, BEA 2024 regional prices and HUD FY2026 rent benchmarks. It does not introduce newer observations.
Florida has the highest one-bedroom rent-to-wage ratio among the report’s 51 state/DC jurisdictions. Its renter-household-weighted rent benchmark is $1,804 a month. At the state’s published electrician median wage of $27.52 an hour, that equals 8.2 eight-hour shifts of gross pay.
The number is a way to compare a standardized rent benchmark with local wages. It does not mean electricians actually spend that amount, that every available apartment costs the benchmark, or that a worker has the full remainder of the month’s pay available after paying rent. Taxes and other expenses remain outside the calculation.
A rent bill means more when compared with wages
The calculation is monthly rent divided by nominal median hourly pay, divided by eight. Using nominal pay keeps the numerator and denominator in local dollars. The report’s separate cost-adjusted wage measure answers a broader purchasing-power question; it is not used as the denominator for the rent calculation.
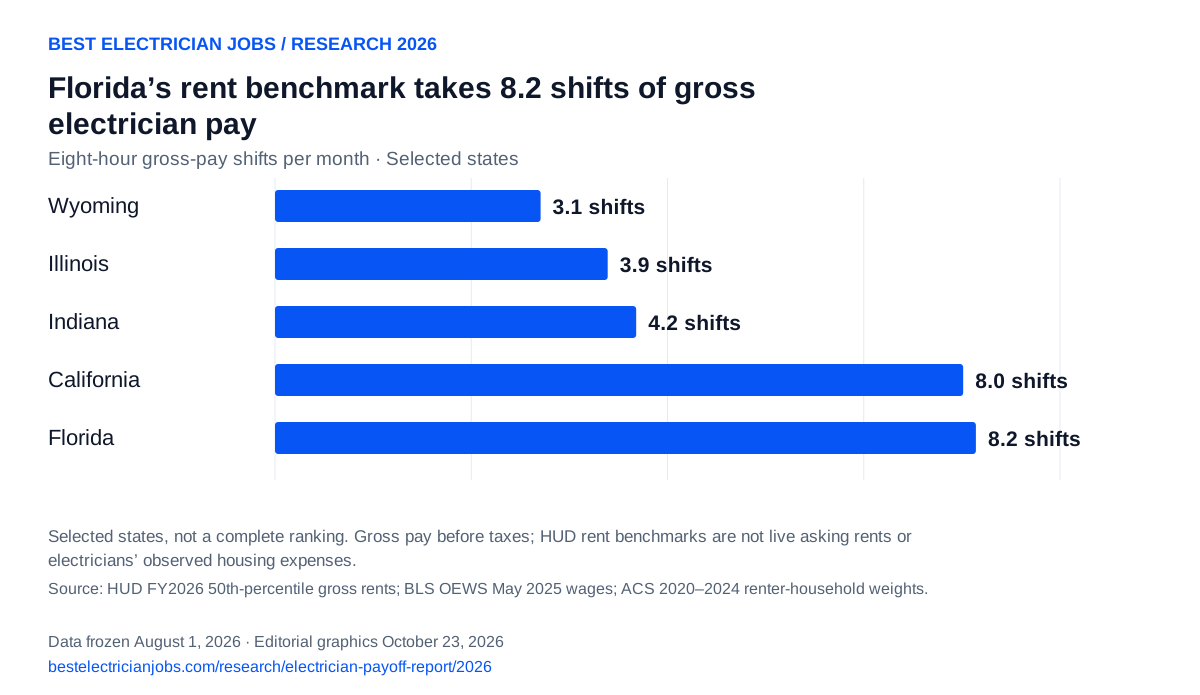
Wyoming’s one-bedroom benchmark equals 3.1 shifts in the same release. California’s is 8.0 shifts. The contrast reflects both the rent benchmark and the wage used to meet it. It should not be read as a comparison of rent levels alone.

Download PNGDownload SVGPermanent finding link
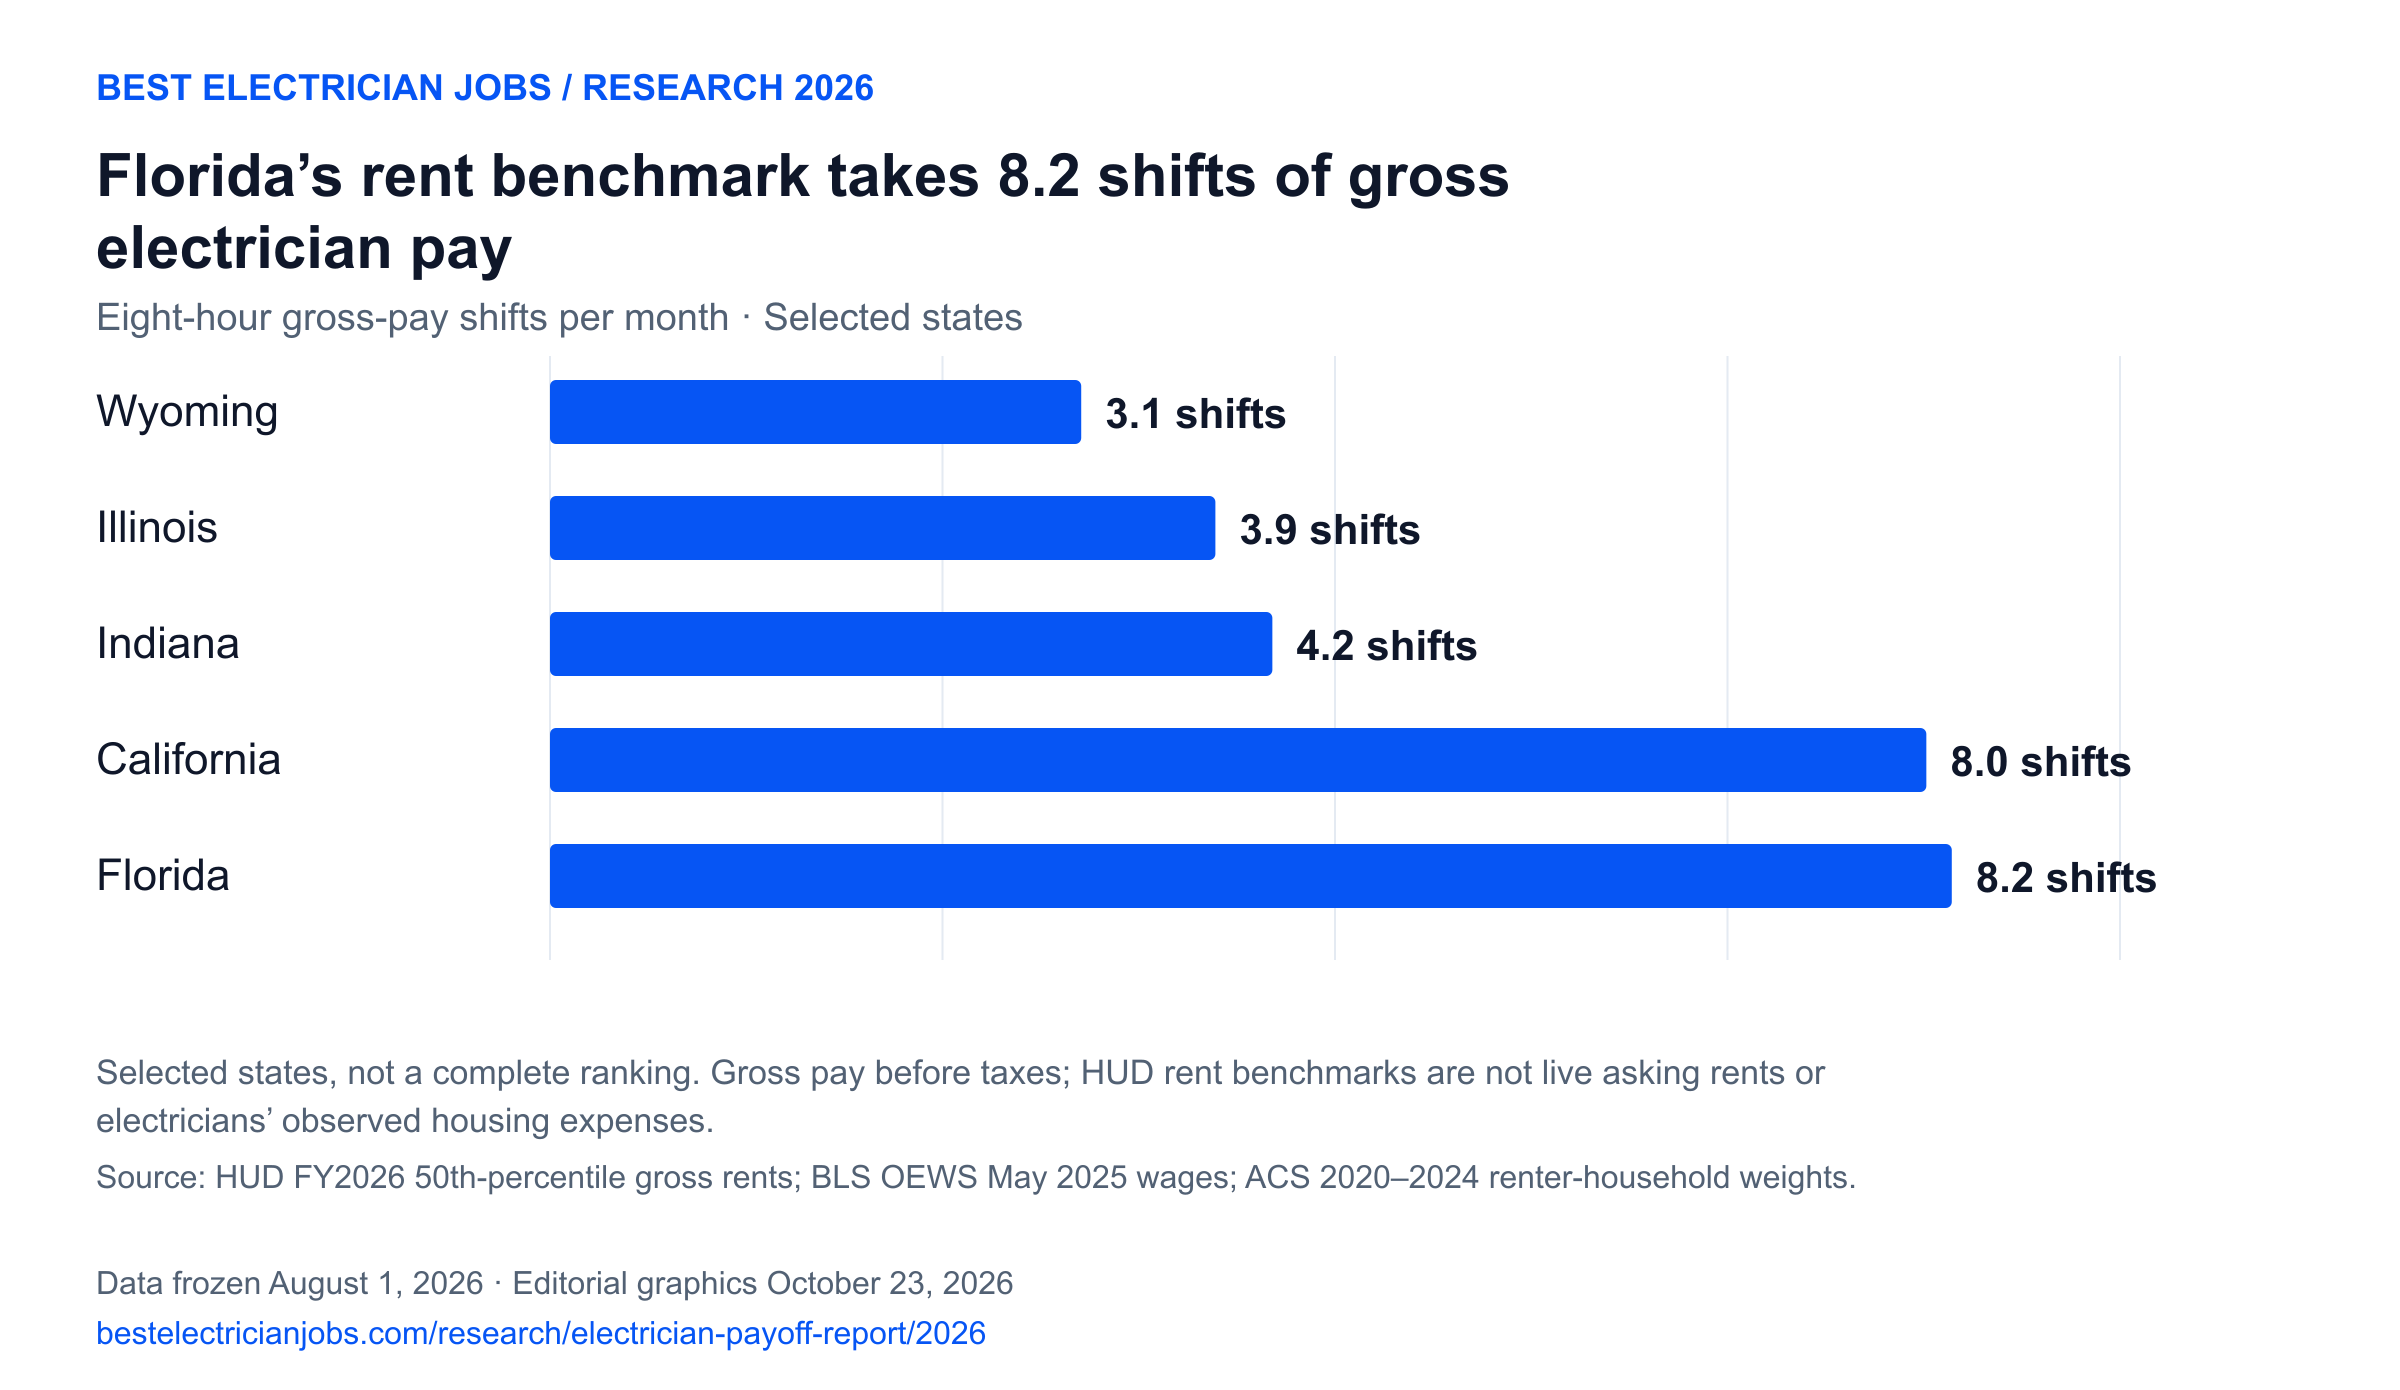
View the chart data
| Place | Eight-hour gross-pay shifts per month |
|---|---|
| Wyoming | 3.1 shifts |
| Illinois | 3.9 shifts |
| Indiana | 4.2 shifts |
| California | 8.0 shifts |
| Florida | 8.2 shifts |
What the statewide rent benchmark represents
HUD publishes 50th-percentile gross-rent estimates for local areas. These are standardized benchmarks, not a live feed of advertised apartments. The report aggregates county estimates using Census renter-household weights, rather than giving a sparsely populated county the same influence as a county with many renters. Split-county HUD areas use the allocation described in the methodology.
Those weighting choices matter. The public methodology and sensitivity files explain how renter weighting differs from a simple county average. The result is a geographic comparison, not an observed housing budget for the electrician population.
Florida’s metro comparisons
These are the highest one-bedroom gross-pay-shift ratios among the Florida metros included in the report. Their wages and rent benchmarks help identify where a statewide description conceals local differences. The selection does not include every Florida city.
| Metro | Median wage/hr | Adjusted pay/hr | 1BR rent / shifts |
|---|
Compare the state with other markets
| State | Median wage/hr | Adjusted pay/hr | 1BR gross-pay shifts |
|---|---|---|---|
| Florida | $27.52 | $26.61 | 8.2 |
| New York | $37.86 | $35.08 | 8.1 |
| California | $36.62 | $33.07 | 8.0 |
| Wyoming | $36.59 | $39.48 | 3.1 |
Use these comparisons as evidence for a specific question. The largest employment count does not identify the most openings, and a high adjusted wage does not account for licensing requirements, overtime premiums, benefits or an individual household’s expenses. The report publishes each measure separately so readers can inspect those tradeoffs.
Check the finding and explore the evidence
Read the national finding, or open Florida in the interactive report. The explorer retains all state/DC and selected metro comparisons, wages, housing measures, employment and quality notes.
The public data package includes state and metro CSVs, an Excel workbook, published ranks, quality flags, the data dictionary, methodology and exact source versions. Review the government sources before using a result. These are observations from the original release, not a description of current job offers or apartment availability.